General Checks:
“show drops all location all”
“show drops”
“show asic-errors all location 0/0/CPU0”
“show asic-errors all location 0/RSP0/CPU0”
Look for active PFM alarms on LC as well as RSP:
“show pfm location all”
Check FPGA Software Is Updated:
“show controllers np summary all”
“admin show hw-module fpd location all”
Check Hardware Diagnostics:
“admin show diagnostic result location all”
Clearing Counters:
“clear counters all”
“clear controller np counters all”
“clear controller fabric fia location”
“clear controller fabric crossbar-counters location”
Checking Interface Stats:
“show interface Gi0/0/0/0 | inc rate” ! Note that this will exclude Ethernet headers and include payload only
Check LC NP Stats:
“sh controller np ports all loc 0/0/cpu0”
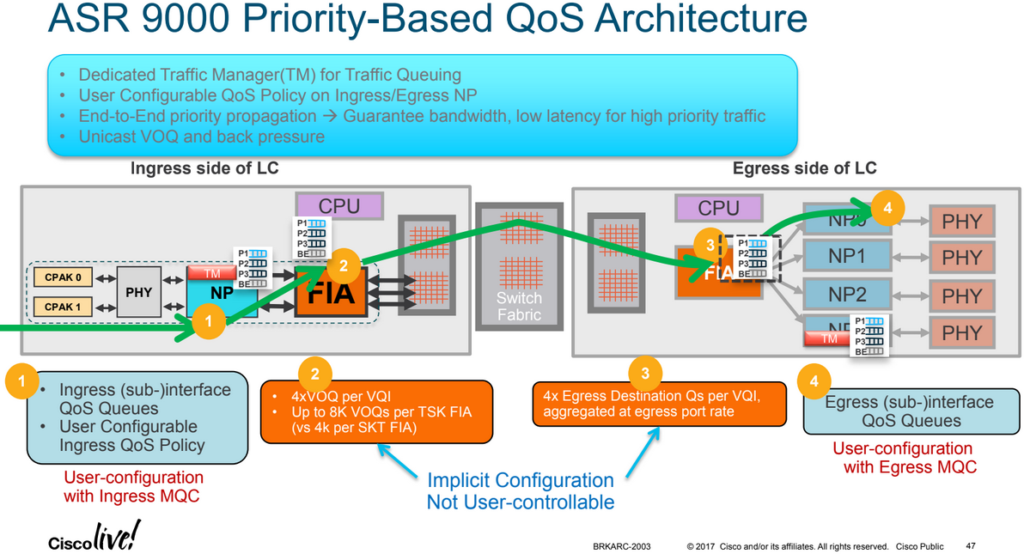
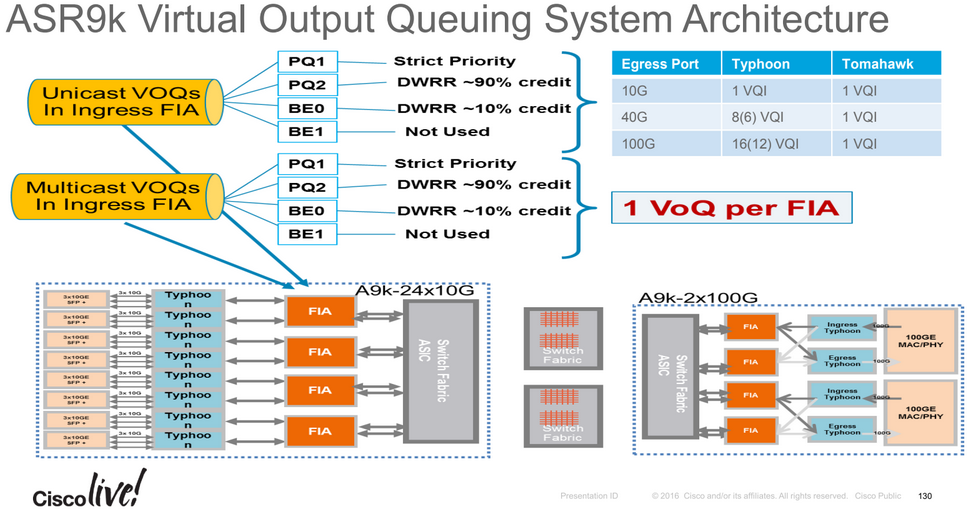
“show controllers pm vqi location all”
“show controllers pm interface Te0/0/0/0”
“show controllers pm location 0/0/CPU0 | i “name|switch”
“show controllers np fabric-counters all all”
Some interesting counters for this command are:
xaui_a_t_transmited_packets_cnt — Num pkt sent by NPU to bridge
xaui_a_r_received_packets_cnt — Num pkt sent by bridge to NPU
When using “show controllers np fabric-counters all all location 0/0/CPU0”, all zero counts can be an indication there are Tx/Rx problems between the NP and FIA.
“show controllers np counters all”
Some interesting counters for this command are:
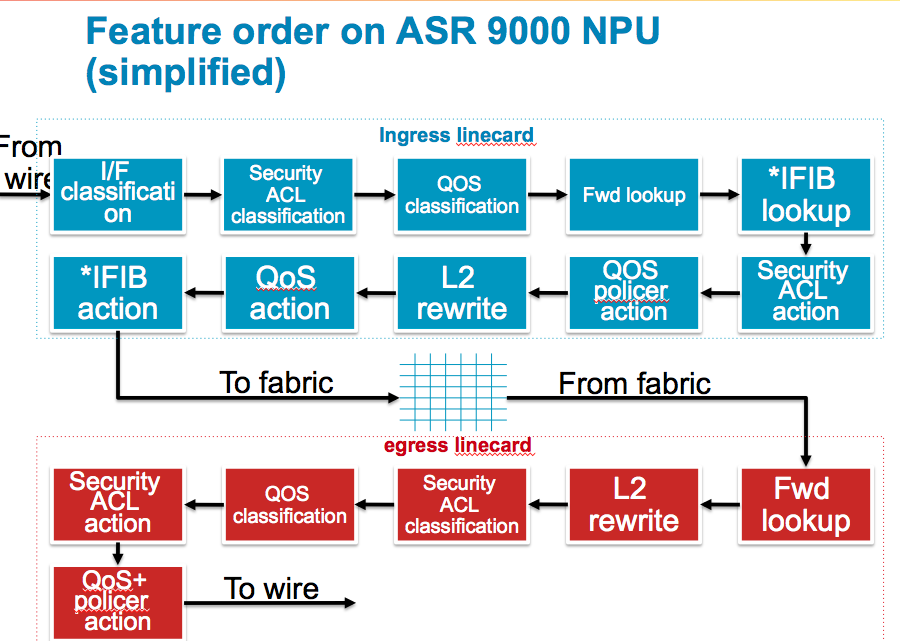
800 PARSE_ENET_RECEIVE_CNT — Num of packets received from external interface
970 MODIFY_FABRIC_TRANSMIT_CNT — Num of packets sent to fabric
801 PARSE_FABRIC_RECEIVE_CNT — Num of packets received from fabric
971 MODIFY_ENET_TRANSMIT_CNT — Num of packets sent to external interface
When using “show controller np counters all loc 0/0/CPU0” the output “No non-zero data counters found” for an NP can be an indication it has locked up.
Check LC FIA & Bridge Stats:
“show controllers fabric fia link-status location 0/0/CPU0”
“show controllers fabric fia stats location 0/0/CPU0”
“show controllers fabric fia q-depth location 0/0/CPU0”
“show controllers fabric fia drops ingress location 0/0/CPU0”
“show controllers fabric fia drops egress location 0/0/CPU0”
“show controllers fabric fia errors ingress location 0/0/CPU0”
“show controllers fabric fia errors egress location 0/0/CPU0”
“show controllers fabric fia bridge *” Trident LC Only
Check RSP Abriter and Xbar Stats:
“show controllers fabric arbiter serders location …”
“show controllers fabric crossbar link-status instance 0 location 0/RSP0/CPU0”
“show controllers fabric crossbar link-status instance 1 location 0/RSP0/CPU0”
“show controllers fabric crossbar statistics instance 0 location 0/RSP0/CPU0”
“show controllers fabric ltrace crossbar last 100 location all”
Check how the interface policy is applied in hardware:
“show qos capability location 0/0/cpu0”
“show qos interface Te0/0/2/1 output”
“show policy-map interface Te0/0/2/1 output” ! Note that this will inlcude Ethernet SA+DA+ETYPE+VLANS+PAYLOAD+CRC
“show qoshal resource summary location 0/0/CPU0”
“show qoshal default-queue interface Te0/0/2/1”


